![]() Per la versione in Italiano: https://www.stradeeautostrade.it/ponti-e-viadotti/il-monitoraggio-come-supporto-al-collaudo-statico/
Per la versione in Italiano: https://www.stradeeautostrade.it/ponti-e-viadotti/il-monitoraggio-come-supporto-al-collaudo-statico/
The community of civil engineers has risen awareness about the health of structures as the detrimental effects that these bring to human kind are of greater concern. Consequently, the testing and maintenance stages of infrastructure are gaining attention.
In the recent years, the safety requirement given by structural guidelines has highlighted deficiencies in existing infrastructures majorly found previous to 1980s. This misconception can be addressed to the lack of knowledge in structural performance.
The fulfillment of the requirement promoted by structural codes and guidelines has been upgraded by several strategies which allow a continuous evaluation of the structure. One of these strategies is Structural
Health Monitoring (SHM), which permits to gather information of the structural performance in a time-frame.

The methodology applied in the case study presented in this paper is a data-driven analysis, which consents the identification of faulty behavior of the instrumented elements, local and globally wise of the structure response. The monitoring approach grants speediness to the assessment of the current state of the structure.
The case study is a box girder bridge characterized by an unknown static scheme, that undergoes the operation of bearing substitutions. A retrofitting activity is carried on in parallel with a monitoring system, which allows a backward identification of the boundary features.
Test of structures
The static testing of bridges and viaducts, required for new and partially retrofitted infrastructures, is assessed through experimental verification. As established in [2], the latter is considered a destructive/nondestructive controlled-method in materials, based on static and dynamic testing.

The controlled methods in materials have the objective of deepening the knowledge of the structure. It is accomplished through structural surveys such as concrete core, sonics, and assessment of the rebar tension.
The static load test allows the assessment of the structural elements: measuring the deflection and stress due to external loads to confirm that the elements are below the threshold of the elastic field and that the total vertical displacement is within known limits, calibrated on accurate models. The loads are applied gradually in such way that the stress is maximized [3].
The dynamic identification tests determine the natural frequencies, the shapes of modes of vibration and the damping value of the structures. These tests supplement the static ones.
Testing is recently being boosted by data-driven analysis. SHM consents a rough assessment of structures due to the possibility of surveying the structures along a timeframe or further, its lifespan.
Verification of structures defines the thin line of human safety; monitoring of infrastructures is a cutting-edge technique the permits a continuous evaluation of the safety requirements.
Coupling SHM with testing allows to mark the evolution of the structural response subjected to external changes.
The case study
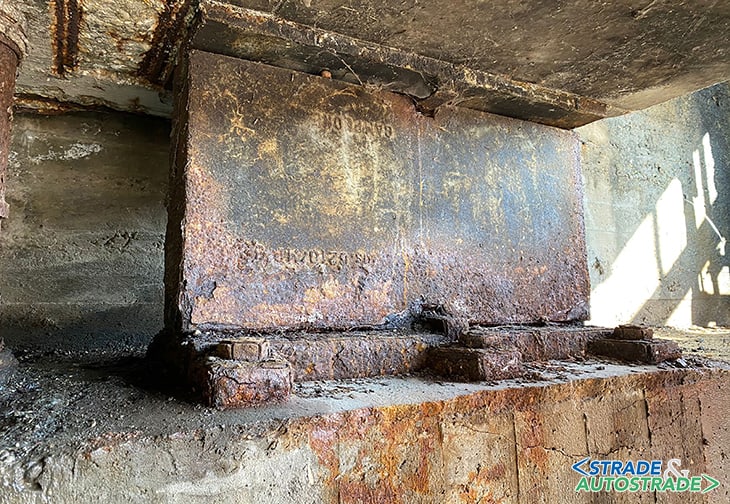
The case study is a prestressed concrete box girder on four supports, characterized by 3 span of 38.6 m for the outers and 78 m for the central. Due to a degraded state of the steel supports found during an inspection, a monitoring strategy is set to indagate in the causes of the possible outcomes of the impairment.
As a result, from the data collected from the sensors, the decision of intervention is realized and included the risen of the carriageway, remotion of existence supports and the installation of new elastomeric supports.
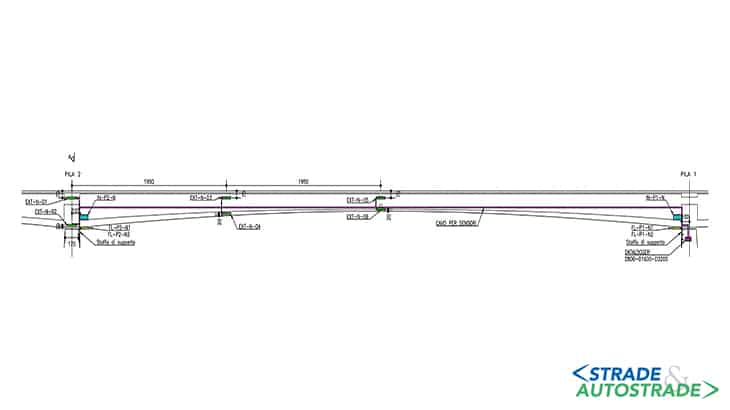
The assessment of the substitution is conducted through a finite element model, developed in MIDAS Civil, and using the output from the gathered data. The monitored strategy was installed as is depicted in Figures 2A and 2B.
The strategy is categorized by:
- a total of ten strain gauges for monitoring the structural deflection;
- a total of two inclinometers for monitoring the deformation of the piles;
- a total of four crack meters for monitoring the displacement of the supports.
The data from this latter is being exposed in this article. In the data analysis, two datasets are handled and coded as Dataset 1 and Dataset 2, which define pre-retrofitting and post-retrofitting respectively.
Data post-processing
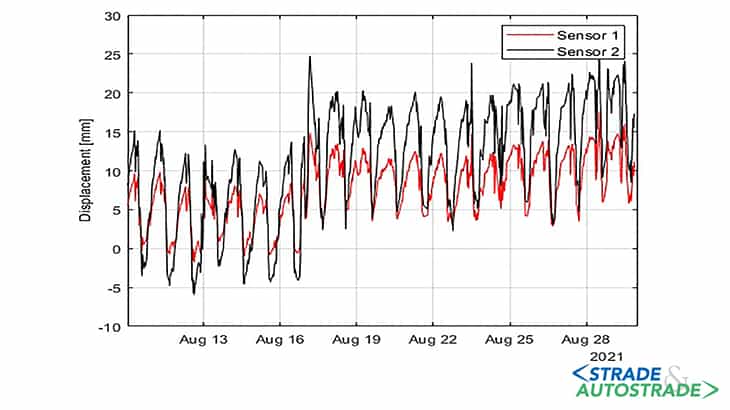
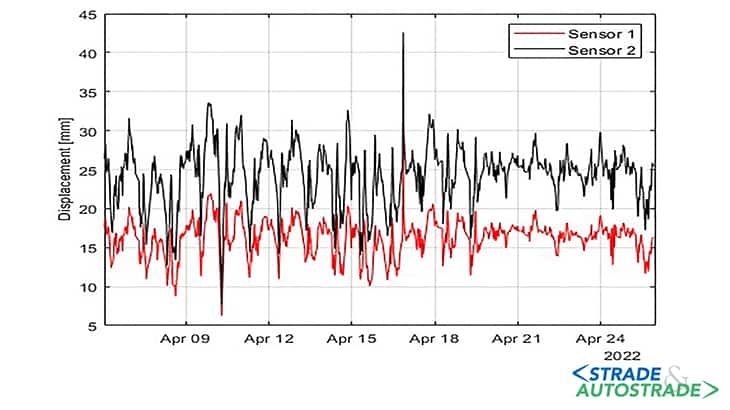
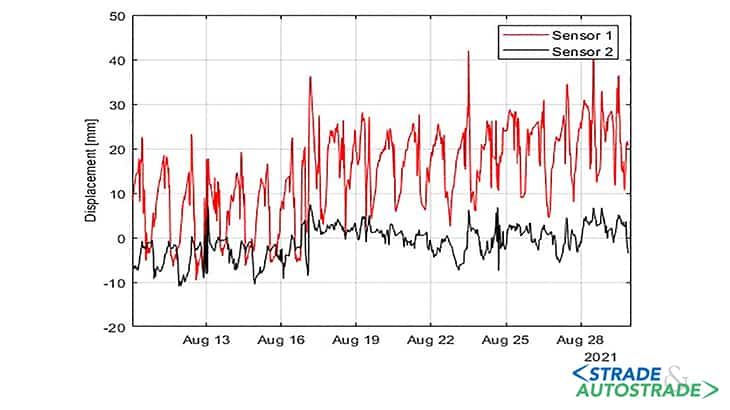
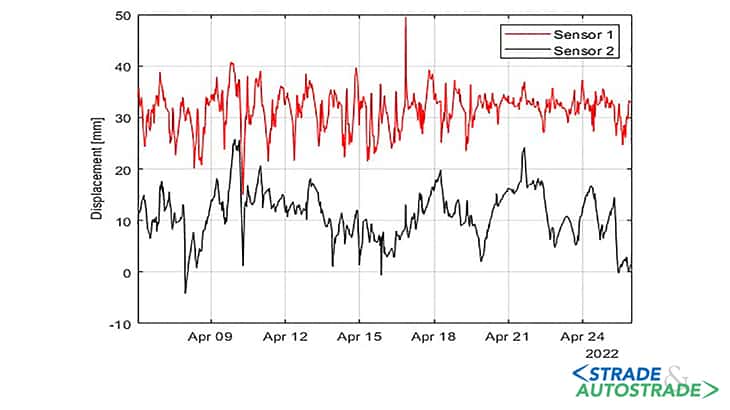
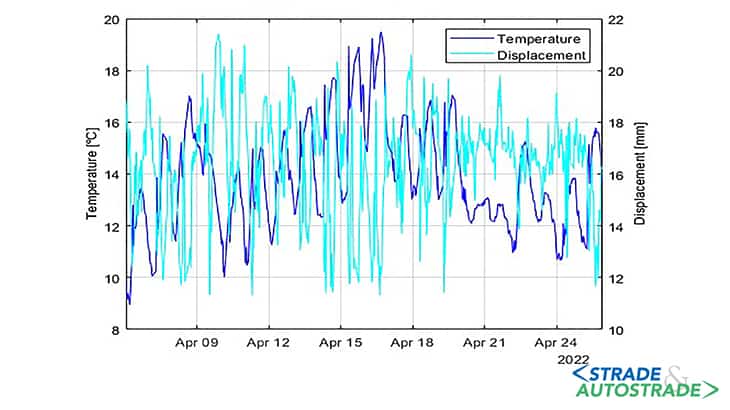
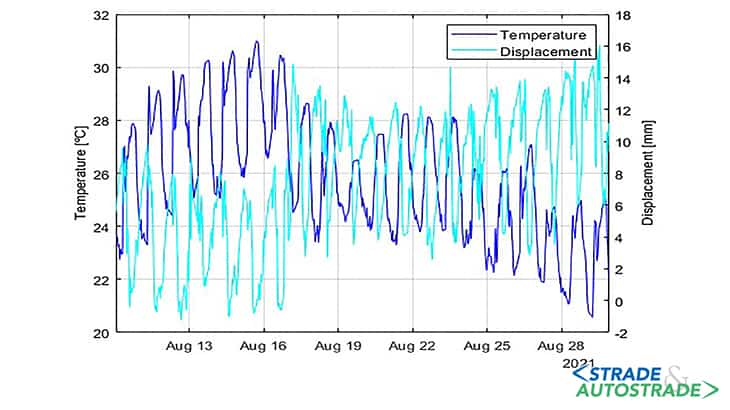
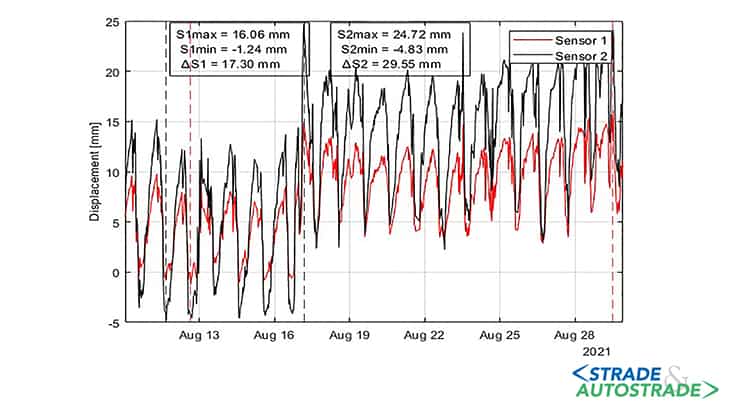
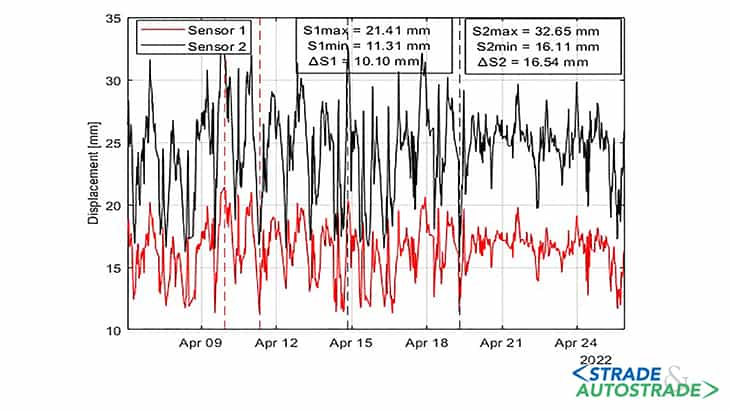
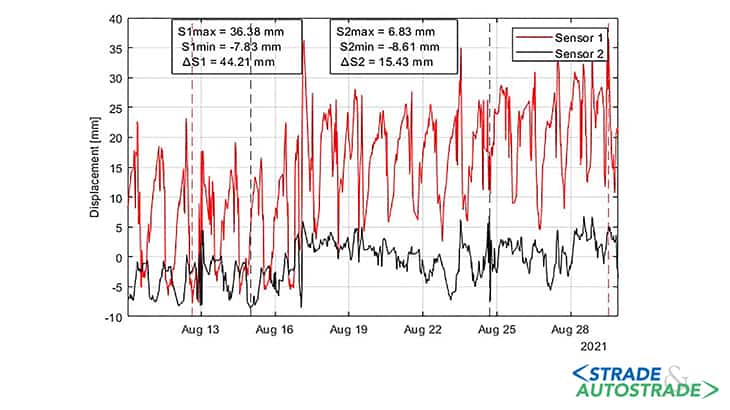
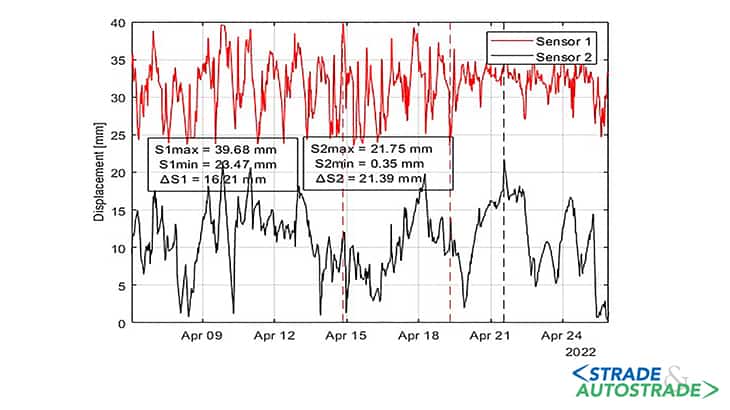
From the monitoring strategy, the gathered data is divided into two subcategories, pre-retrofitting and post-retrofitting. The acquisition of this database is known as raw data, the main features acquired for the further analysis are the displacements and the temperature, as depicted in Figures 3A, 3B, 3C and 3D.
 and pile 2 (5B) results")
The data is further treated with the process of cleansing to identify outliers would mislead the analysis. In both cases, a statistical approach is used, for the temperature datasets, a moving mean is used and is set to have one-day time window.
The moving mean is an approach that considers the mean value for a given data which is defined by a time-frame.
For the displacement, standard scores, also known as z-scores, implemented with a threshold that defines an appropriate curve of data points. The statistical approach defines a value to highlight according the difference between the distance from the mean and the standard deviation [5].
The treated temperature datasets are analyzed and one timeframe for each dataset is selected in order to have the same temperature variation (ΔT). The ΔT for the Dataset 1 is found to be 10.43 °C and 10.53 °C for the Dataset 2.
The maximum and minimum displacements from both datasets are evaluated to be compared with the FEM model and are shown in Figures 5A and 5B. The curved defined by the time-history of displacement is shown in Figures 6A, 6B, 6C and 6D.
Finite element model
FEM analysis is used to developed the case study to further analyses the state of the structure. The box girder bridge is developed in MIDAS Civil, with the use of beam element with the geometrical and mechanical properties of the as-built features of the bridge were implemented.
The model is loaded with self-weight, uniform and gradient temperature. National and international guidelines provide detailed instructions for the thermic load [1]. However, the thermal load is defined with the results from the data collected, where the uniform variation of temperature is input as 10.5 °C and the gradient of temperature is calculated with the output of the Dataset 1 from the selected time-frame.
The temperature gradient, shown in Figure 8, was evaluated as the discrete data points from the sensor divided by the height of the box girder which led to a ∇T equals to 1.10 °C/m. Thermal distortion was considered in its two components described above, and not with use of the fifth-degree law as shown in [4].

The results
In Dataset 2, for sensors both piles, the results displacements show a noticeable reduction. However, a greater diminishing value was found in pile 1.
The previous uncertainty of the static scheme that was addressed to the support was removed with the retrofitting strategy, where the FE model output complies with the data collected from the Dataset 2.
The juxtaposition of the results from the previous mentioned analysis are shown in Figura 9, where is evident that the displacements given by the unknown static scheme configuration were reduced for both piles after the retrofitting strategy. MIDAS Civil outputs show a relatively good agreement with respect to post-retrofitting results.

Conclusion
Monitoring enhances the evaluation of structures and infrastructures permitting the continuous verification of the structural performance. This cutting-edge structural survey allows highlighting possible drawbacks of structural health-wise, reinforcing the decision-making process to improve the performance of the structure.
The assessed three span box girder bridge, which was retrofitted due to uncertainty in terms of static scheme, was parallelly monitored to check its structural performance. The use of the dataset from the monitoring scheme in both, as input of the finite element model and as comparison to the results of the FEM, allowed the validation and certification of the testing.
The case study shows the influence of the new static scheme of the box girder bridge, which is defined simply as the substitution of the bearings of the abutment. The structural performance, in terms of displacement of the bearings resulted in good agreement with the ideal performance obtained from the finite element model. Therefore, it is demonstrated that monitoring enhances the test verifications of structures.

References
[1]. European Committee for Standardization, n. 1991-1-5 Eurocode 1: Actions on structures – Part 1-5: General actions – Thermal actions, 2004.
[2]. A. Bonaldi, E. Panzeri, P. Panzeri – “Il collaudo e il controllo di ponti e viadotti”, “Strade & Autostrade” n° n° 94 Luglio/Agosto 2012, pag. 59.
[3]. P. Salomone – “Prove di carico su solai, ponti e viadotti: cosa dicono le NTC 2018?”, Ingegneri.cc, 2019, https://www.ingegneri.cc/prove-di-caricosolai-ponti-viadotti.html/.
[4]. F. Rendace – “Effetti dell’azione termica nei ponti in calcestruzzo con distrivuzione lineare e non lineare applicando gli Eurocodici”, https://www.ingenio-web.it/32539-effetti-dellazione-termica-nei-ponti-in-calcestruzzo-con-distribuzione-lineare-e-non-applicando-gli-eurocodici, Ingenio, 2021.
[5]. C.H. Brase, C.P. Brase – “Understanding basic statistics”, Brooks/Cole Cengage Learning, 2013.
![]() Per la versione in Italiano: https://www.stradeeautostrade.it/ponti-e-viadotti/il-monitoraggio-come-supporto-al-collaudo-statico/
Per la versione in Italiano: https://www.stradeeautostrade.it/ponti-e-viadotti/il-monitoraggio-come-supporto-al-collaudo-statico/