
Correlation between Covid-19 and traffic vehicle pollution ![]() Per la versione in Italiano: https://www.stradeeautostrade.it/ambiente-e-territorio/la-correlazione-tra-covid-19-e-inquinamento/
Per la versione in Italiano: https://www.stradeeautostrade.it/ambiente-e-territorio/la-correlazione-tra-covid-19-e-inquinamento/
Since the beginning of what has been called a Coronavirus pandemic the infection-fatality-ratio and deaths data pushed the Governments to impose restrictions on normal activities. The following analysis started in early January.
At that time, one could only analyze Chinese data: there was no correlation between population and Coronavirus disease but the numbers, in January 2020, referred only to China.
And if some doubted about the veracity of either source, as a practice in any scientific research, it was appropriate to map all the data after weighing up all the relevant information.
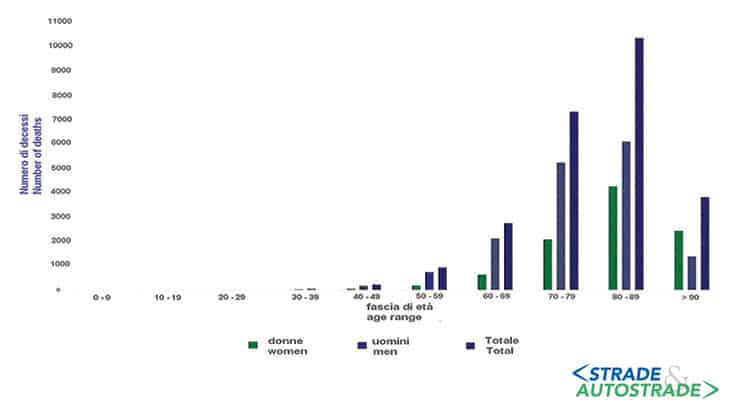
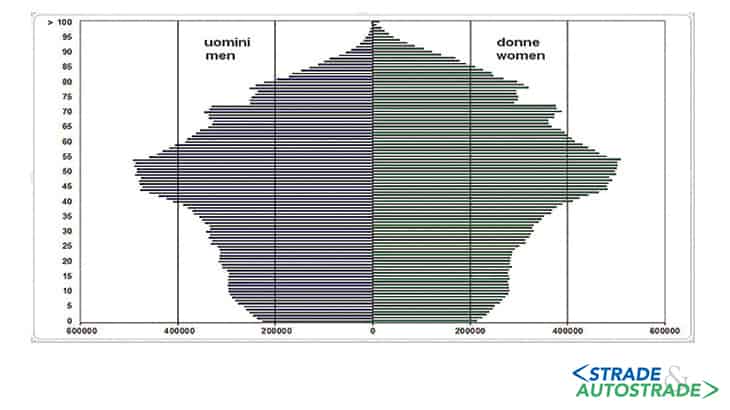
In the face of a very large contagion, mortality rates affected only the elders and the male population (Figure 1). Extraordinary case, since statistics proves that women are much more numerous than men (Figure 2): the doctors questioned themselves on why women were responding better to the treatments and we all questioned ourselves on the cursus studiorum picked by the civil protection workers.
If a non-gendered disease affects a part of the population, the most represented gender should necessarily be the most affected. For Coronavirus it does not occur. But this is already a clue.
Doctors worry about the infections, about the number of beds in intensive care, but instead of focusing on the numbers of people affected, it’s much more useful and interesting to research causes and locations…
It’s an occupational hazard typical of those who analyze road accidents: and it so began the research on the black spot areas of Coronavirus infection.
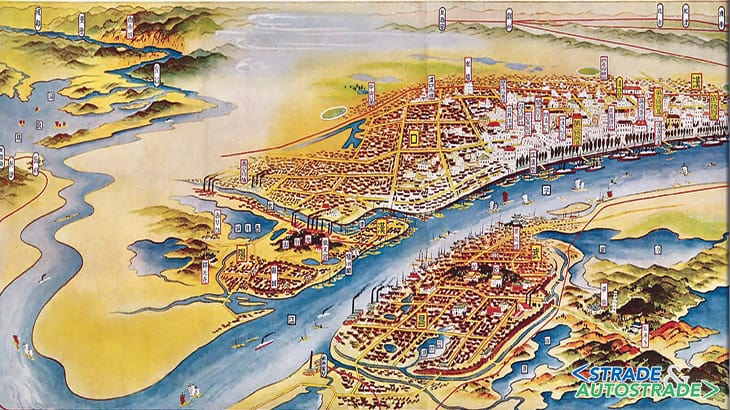
As one searches for black spots in road accident analysis, in this case it was necessary to observe the regions with the largest number of infected and deceased. Wuhan (Figure 3).
Who is looking for the map of Covid-19 black spots considers the high industrialization of Wuhan while reading about phantom bat viruses.
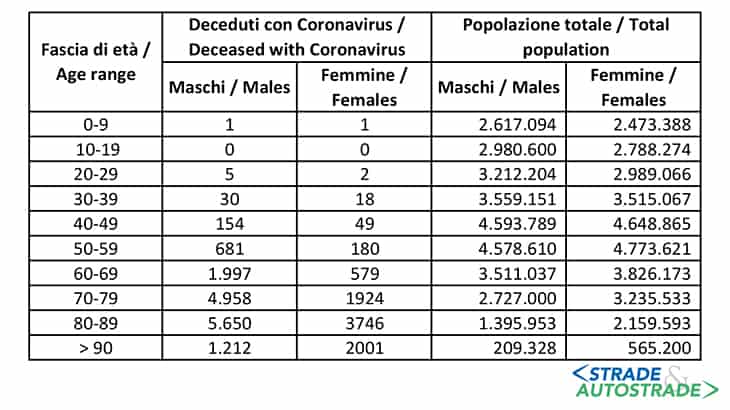
If such a contagious disease causes death in an area as large as Wuhan’s (11 million population) but the mortality rate is just 0,04%, this virus is infectious, but it’s lethal only for some categories of people.
The other Chinese Coronavirus outbreak is in Harbin; Harbin is sadly known for having been the site of the complex called 731 Unit where for a long time the Japanese conducted brutal bacteriological experiments on the Chinese population.
Here, beyond the contagion and mortality data, information relating to food stocks are disclosed. Official statistics anyway will always indicate fewer cases than those recorded in the Hubei province (Wuhan).
The Coronavirus infections arrives in Italy and mapping the data the first correspondences arise. While everyone is scrambling to find a relationship between traffic vehicle pollution and Covid-19 those who analyzes the data in a scientific way considers that a correspondence is not possible between these two factors knowing that deaths occur almost exclusively (in Italy) only elders (Figure 4 below).
If there was a correlation between Covid-19 and traffic vehicle pollution, those who live in the city (males and females) area would have been killed off. Citizens of Milan already appreciate when they can breathe in public gardens… and women often move on foot inhaling much more polluting forces. No, the Coronavirus correlation and deaths is elsewhere, into the air (maybe).
If motor vehicle emissions were the cause, urban cyclists would have died already in January or February 2020. Together with taxi drivers and municipal police.
The studies highlight some specific aspects and the investigation begins. Everyone wonders about population density factors, high volumes of traffic, but no one who goes into detail.
It is necessary the totality of data to understand why institutions decided for a questionable lockdown: all activities have been blocked due to an epidemic that is contagious for all but fatal only for the elderly population, a choice that led to the collapse of the economy.
The analysis highlights statistical anomalies in certain areas of the territory (Figures 5A e 5B).
Regarding the italian situation, the analysis shows statistic anomalies is specific areas: the number of deaths is more consistent in some counties than in the metropolitan area. Data referring to deaths in the first quarter of all years between 2015 and 2020 show the tragedy caused by the Coronavirus in Bergamo area.
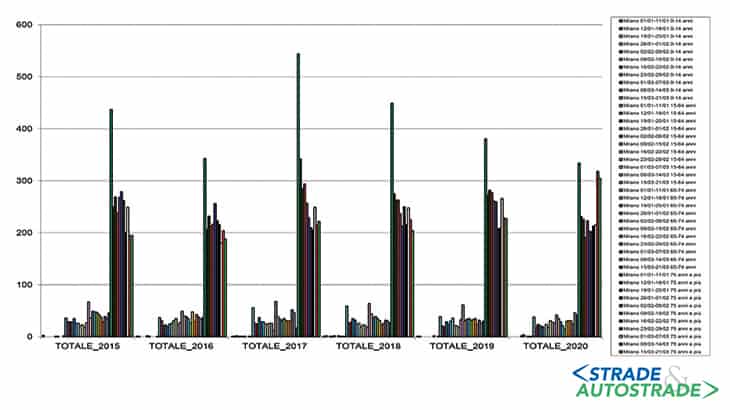
The analysis of deaths by individual age group shows very different data for Milan (Figure 6). Does it makes it possible to exclude to generic air quality from the causes of Covid-19? Partially, yes.
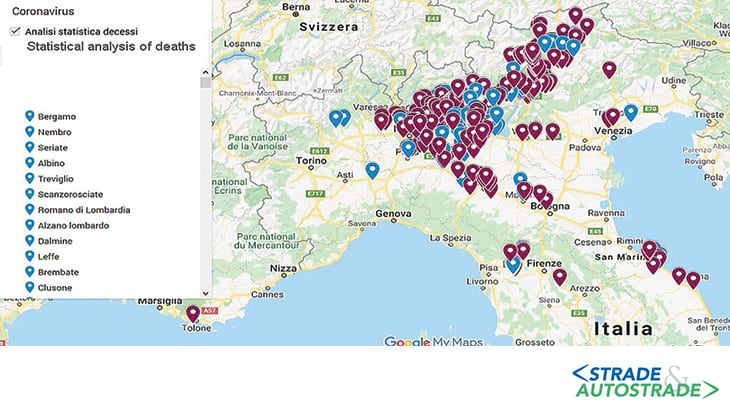
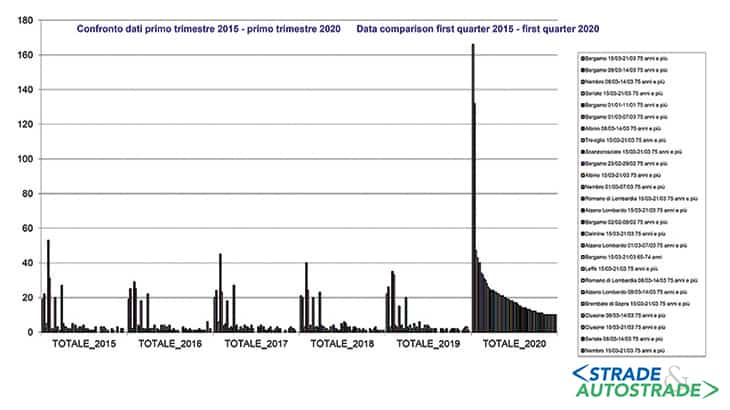
The analysis therefore continued considering the mortality data for all the Municipalities of the Province of Bergamo, comparing the deaths recorded in the past five years and those recorded in this first three months of the Covid-19 spread. And the response was immediate.
Some municipalities have statistical anomalies and therefore the data have been precisely mapped. The number of deaths in Bergamo’s county shows that the traffic vehicle pollution is not correlated to the disease. If it was, the mortality would have been distributed among age classes.
The concentrations in air of PM10, ozone and nitrogen dioxide are not linked in a simple way to the emission sources, but are mediated by a series of chemical and physical processes.
Among other things, their formation occurs simultaneously with the processes of transport and dispersion into the atmosphere, so the affected area is much more extensive than for example carbon monoxide pollution (see “Strade & Autostrade” n. 115 January/February 2016, page 162).
However, public rulers did not consider whether there was a secure correlation between contagion and air quality: they almost took it for granted and blocked everything.
But vehicular traffic isn’t the main source of emissions for every pollutants, but only some of them.
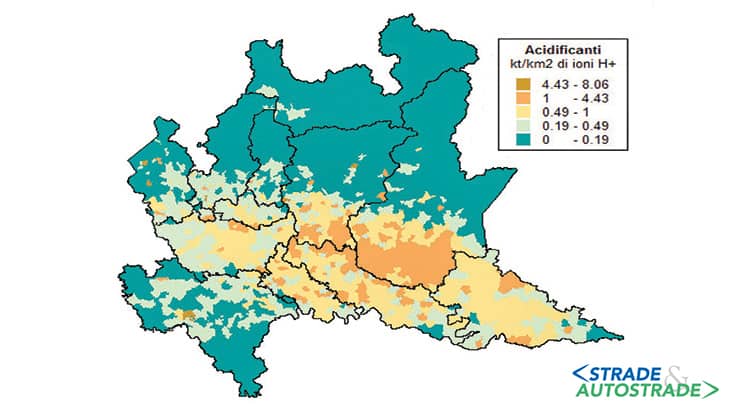
In the case of sulfur oxides (SOx), precursors of secondary PM10, the most relevant emission sectors are those of industry and energy (and this explains the very high values of PM10 in some provinces of Lombardy (Figure 7).
On the one hand, it is therefore obvious how the public decision-maker had to establish in advance: which could be the pollutants whose emissions needed to be drastically reduced in a period of the respiratory disease (SARSCoV-2) and where (analyzing the data of the deceased rather than the outright infected) this move needed to be made.
On the other side it is quite clear that declaring a lockdown first deciding for a temporary closure and now extending it hasn’t been a smart move – especially if we consider its effect on economy – since it’s not clear yet which are the reasons why a particular case of Covid-19 needs hospitalization in intensive care, or dies, or can fall under a type.
Then it will be said that it was for public well-being but perhaps this analysis should have been made before the lockdown.
The analysis of statistical data made it possible to exclude some hypotheses made by various scientists: firstly the correlation between vehicle traffic pollution and deaths.
Secondly accurate cartographic representation regarding all available data (number of deaths per single municipality) and age of the deceased subjects addressed the following hypothesis: all areas with high mortality since Covid-19 are characterized by being places of localities of steel industry production but the deaths in Bergamo’s county are almost exclusively elders.
Consequently, the Coronavirus contagion is lethal only if one has inhaled Sulphur dioxide in previous decades. For this reason, Coronavirus does not lead young people and adults who are not affected by other diseases to death.
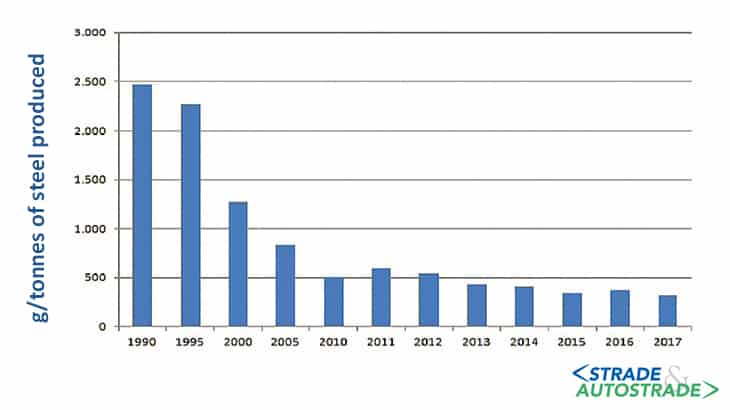
Fortunately, between 1990 and 1995 the steel industry has been required to change its production processes and the Sulphur dioxide emissions (in Italy) have drastically reduced (Figure 8 above).
This has not happened in other countries of the world and this explains why mortality in other states refers to all age groups.
This hypothesis of close correlation between Covid-19 and necessary hospitalizations in critical care has been verified by Irish data, which show a precise correspondence between counties with numerous cases and the presence of steel industry.
But maritime transport also represents a source of emissions: Sulphur dioxides (SOx) are known to be harmful to human health, cause respiratory symptoms and lung diseases and the correlation between Covid-19 epidemiological data and geographical distribution proves that inhaling SOx in the presence of Coronavirus causes the necessity of an urgent hospital treatment.
Other recent studies have tried to correlate industrial breeding emissions and Covid-19 cases, but comparing the data there is no correspondence on the fact that long-term exposure to generic polluting emissions of particulate matter 2.5 causes an increase in the Coronavirus mortality rate: Irish data confirm it.
But above all it is confirmed by the fact that there are no industrial breeding (neither bovine nor swine) in Wuhan proximity.
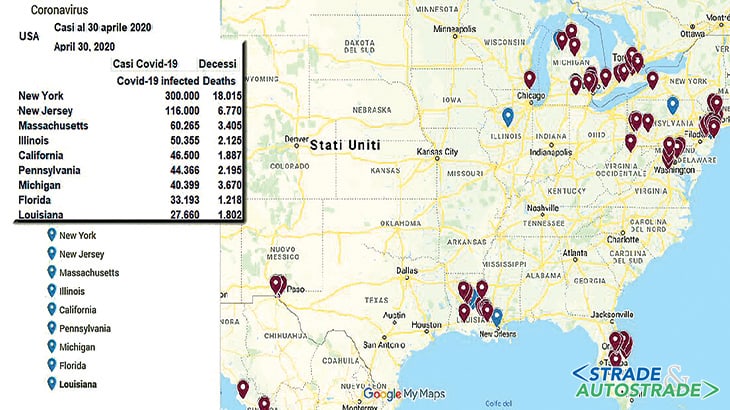
The analysis of the Covid-19 infected and deceased in the USA (Figure 9) confirms the above-mentioned hypotheses: once infected, the hospitalization is necessary for people. That have worked in the metallurgical sector or are residents in locations where there are steel industries or power station.
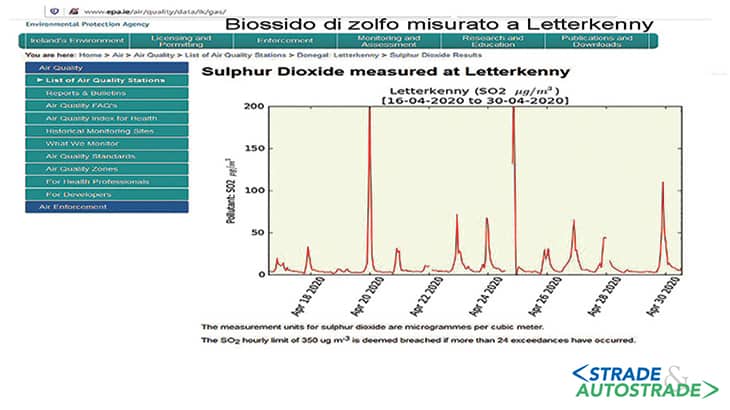
That have inhaled Sulphur dioxide, because they live near harbours (especially areas characterized by reduced ventilation such as Donegal in Ireland or in the Hudson riverbanks area).
For Donegal – Letterkenny in Ireland see http://www.epa.ie/air/quality/data/lk/gas/, http://www.donegalcoco.ie/services/environment/pollutioncontrol/air%20pollution/, https://www.epa.ie/pubs/reports/air/quality/epaairqualityreport2018.html and https://www.epa.ie/pubs/reports/air/quality/.
Sulfur dioxide is naturally emitted by volcanoes and this explains both the Covid-19 deaths in Mexico (Popocatépetl in October 2019 and January 2020 erupted multiple times) and explains well the numerous deaths in some places south of Etna in Sicily.
Bibliography
[1]. World Health Organization – “Air Quality Guidelines for Europe”, WHO Regional Publications, European Series, No. 91, Copenhagen, 2000.
[2]. M.D. Lebowitz, G.A. Fairchild – “The effects of sulfur dioxide and A2 influenza virus on pneumonia and weight reduction in mice: an analysis of stimulus-response relationships”, in Chemico-Biological Interactions, volume 7, Issue 5, November 1973, pages 317-326, https://doi.org/10.1016/0009-2797(73)90006-9.
![]() Per la versione in Italiano: https://www.stradeeautostrade.it/ambiente-e-territorio/la-correlazione-tra-covid-19-e-inquinamento/
Per la versione in Italiano: https://www.stradeeautostrade.it/ambiente-e-territorio/la-correlazione-tra-covid-19-e-inquinamento/